For web editors
To debug ONLYOFFICE plugins in the web editors, follow the instructions below,
-
Add the debugger command to your script:
(function (window, undefined) {window.Asc.plugin.init = function () {this.callCommand(function () {debugger;var oDocument = Api.GetDocument();var oParagraph = Api.CreateParagraph();oParagraph.AddText("Test Example");oDocument.InsertContent([oParagraph]);});};})(window, undefined); -
Open the developer console by pressing the F12 button.
-
Open the Plugins tab and run the plugin.
tipPlease note that the debugger command will only work if the development tools are open. Otherwise, the browser will ignore it.
Debugging overview
When developing ONLYOFFICE plugins, debugging is essential for identifying and resolving issues. The plugin environment has several specific characteristics that make debugging unique:
- Isolated environment - Plugins run in a separate iframe, which means they have their own JavaScript context
- Asynchronous communication - Plugins interact with the editor through asynchronous API calls
- Multiple contexts - You need to handle both plugin context and editor context
- Scope management - Variables need careful handling between different scopes
- Cross-platform considerations - Web and desktop editors require different debugging approaches
To effectively debug your plugin, you can use various tools and techniques available in modern browsers. The most common approaches include:
- Console logging for tracking execution flow and variable states
- Breakpoints for step-by-step code execution
- Frame inspection for managing different execution contexts
- Network monitoring for API calls and resource loading
Console output
Use console methods to inspect values and application state:
console.log("Debug:", value);
console.info("Info:", info);
console.warn("Warning:", warnValue);
console.error("Error:", errorObj);
Select the plugin's frame in the Console drop-down before evaluating expressions so logs and evaluations run in the correct context.
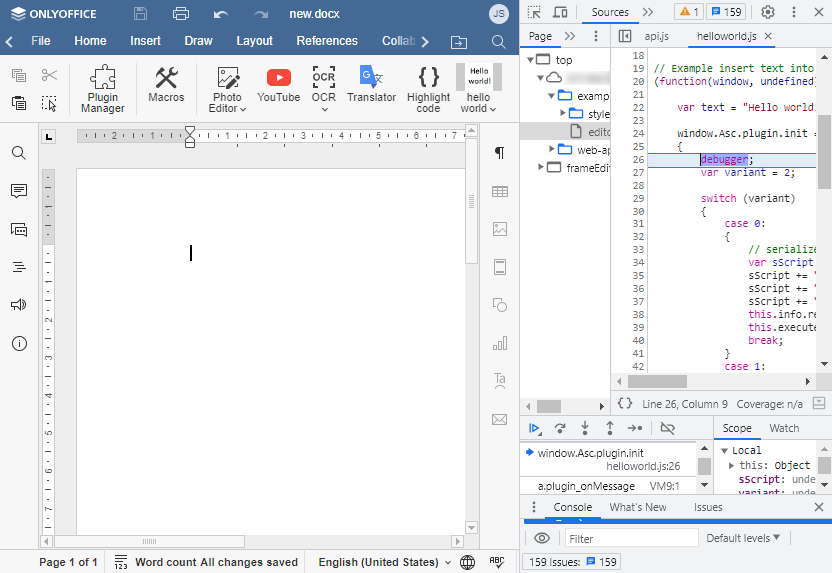
Breakpoints
-
Programmatic breakpoints - Insert a debugger statement where you want execution to pause.
(function (window, undefined) {window.Asc.plugin.init = function () {this.callCommand(function () {debugger;// Your code});};})(window, undefined);tipMake sure DevTools are open before running the plugin script.
-
Chrome DevTools breakpoints
- Open Sources tab
- Find your plugin file
- Click on the line number to set a breakpoint
Frame Management
- Plugin runs in a separate iframe
- Select the appropriate frame in the console to access plugin context:
frameEditor: Main editor frameiframe_{asc_id}: Frame of the specific plugin
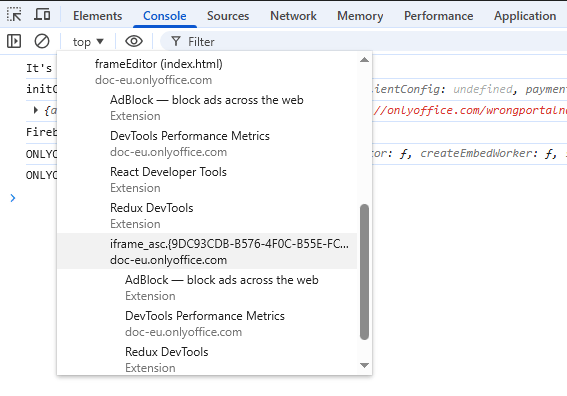
Always ensure the plugin iframe is selected before inspecting variables, setting breakpoints, or executing code snippets.
Debugging checklist
- Confirm the plugin is installed and enabled.
- Ensure all files (
index.html,config.json,assets) are present and reachable. - Validate
config.jsonstructure and paths. - Check the console for errors before continuing.
Common issues
CORS
- Start your local server with the
--corsflag (http-server --cors). - Ensure document server is installed and accessible.
- Serve plugin resources over HTTPS when required by the editor.
JWT
- Verify the secret key in Document Server config:
%ProgramFiles%\ONLYOFFICE\DocumentServer\config\local.json(services.CoAuthoring.secret.browser.string) - Ensure tokens are valid (not expired) and correctly formed (
header.payload.signature).