Debugging
You can debug any Document Builder component. To do this, follow the instructions below.
Executing from a browser (for plugins and macros)
-
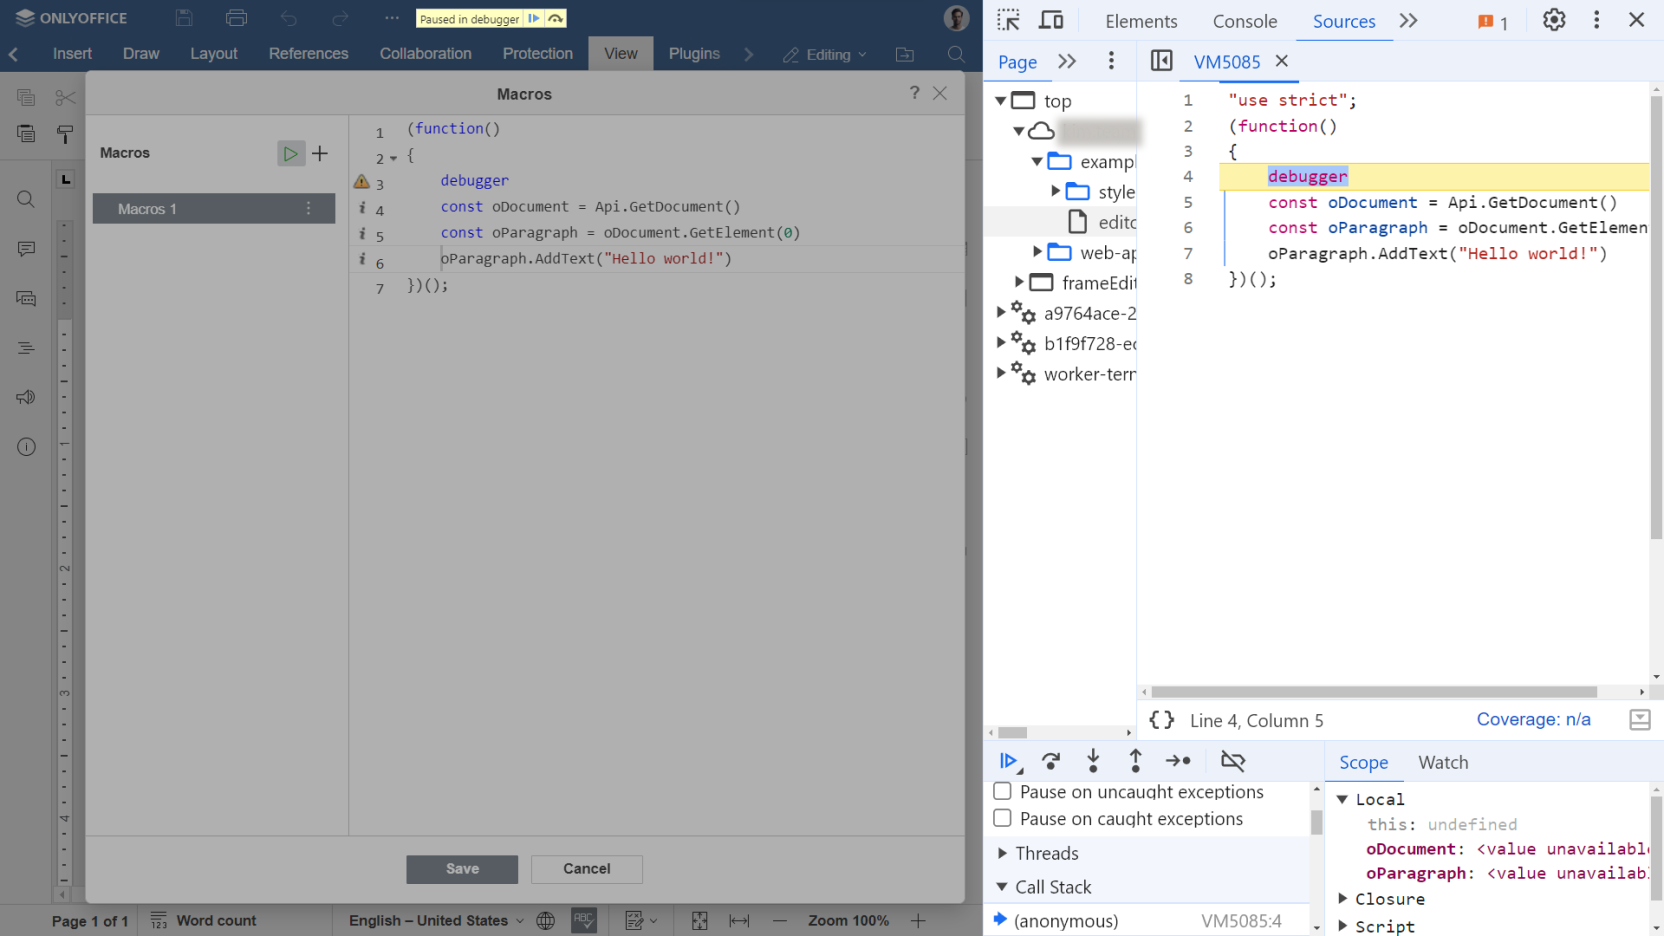
Open the View tab and click Macros.
-
Use the debugger command in your script:
debugger;
const oDocument = Api.GetDocument();
const oParagraph = oDocument.GetElement(0);
oParagraph.AddText("Hello world!"); -
Open the developer console by pressing the F12 button.
-
Click
to run your script.
Please note that the debugger command will only work if the development tools are open. Otherwise, the browser will ignore it.

The debugger command works as a breakpoint and pauses the execution at the script point where this command is inserted.
Executing from Builder.Framework or Builder.App
This instruction can also be used for any Builder.Framework version: C++, COM, .Net.
-
Open a terminal in the DocumentBuilder folder.
-
Set the V8_USE_INSPECTOR environment variable to 1:
- Windows
- Linux
SET V8_USE_INSPECTOR=1export V8_USE_INSPECTOR=1 -
Run the Builder script with the docbuilder command:
docbuilder script.docbuilder -
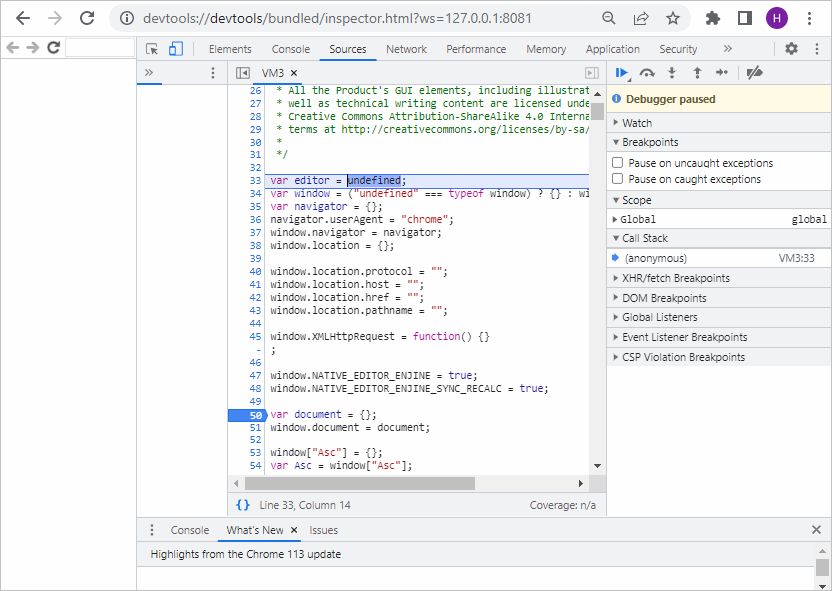
A link will appear in the terminal. You must open it in your Chrome/Chromium browser to connect to the JavaScript context.
-
Set the breakpoints by clicking the line numbers and run your script again.
-
Now you can debug the executed methods.
